MODEL
Connect events. Shape the logic.
Edit basic events, gates and connections in a fault tree (FT). Express how combinations of equipment failures or other events lead to a top event.
FROM MODEL TO INSIGHT
Build the model. Quantify the risk. Trace the reasoning. Analysis software for engineers and researchers working with PRA.
See a fault tree quantification example
Review the structure and inputs of your model, set the conditions, and calculate. From the resulting numbers, return to the events that give rise to risk.
MODEL
Edit basic events, gates and connections in a fault tree (FT). Express how combinations of equipment failures or other events lead to a top event.
QUANTIFY
Select the analysis target and method, then set cutoffs and calculation limits. Interpret the numbers with an understanding of the approximations and truncation conditions.
UNDERSTAND
Examine the top event probability and, where available under the calculation conditions, minimal cut sets (MCS) and importance measures. Review the settings and warnings as you consider which events contribute to risk.
Event A occurs, or events B and C both occur. Follow the logic of a simple fault tree and examine its quantified result.
The minimal cut sets (MCS) are {A} and {B, C}.
THE CALCULATION
0.01 + 0.02 × 0.03 − 0.01 × 0.02 × 0.03 = 0.010594
Hand-calculated reference for independent events: A = 0.01, B = 0.02, C = 0.03. The schematic and reference below are not a live calculation.
A, B and C are mutually independent basic events. A alone, or B and C together, leads to the top event.
Top event probability
0.010594P[A ∪ (B ∩ C)]| Events | Order | Probability |
|---|---|---|
| { A } | 1 | 0.01 |
| { B, C } | 2 | 0.0006 |
The cut sets overlap, so adding their probabilities directly does not give the top event probability.
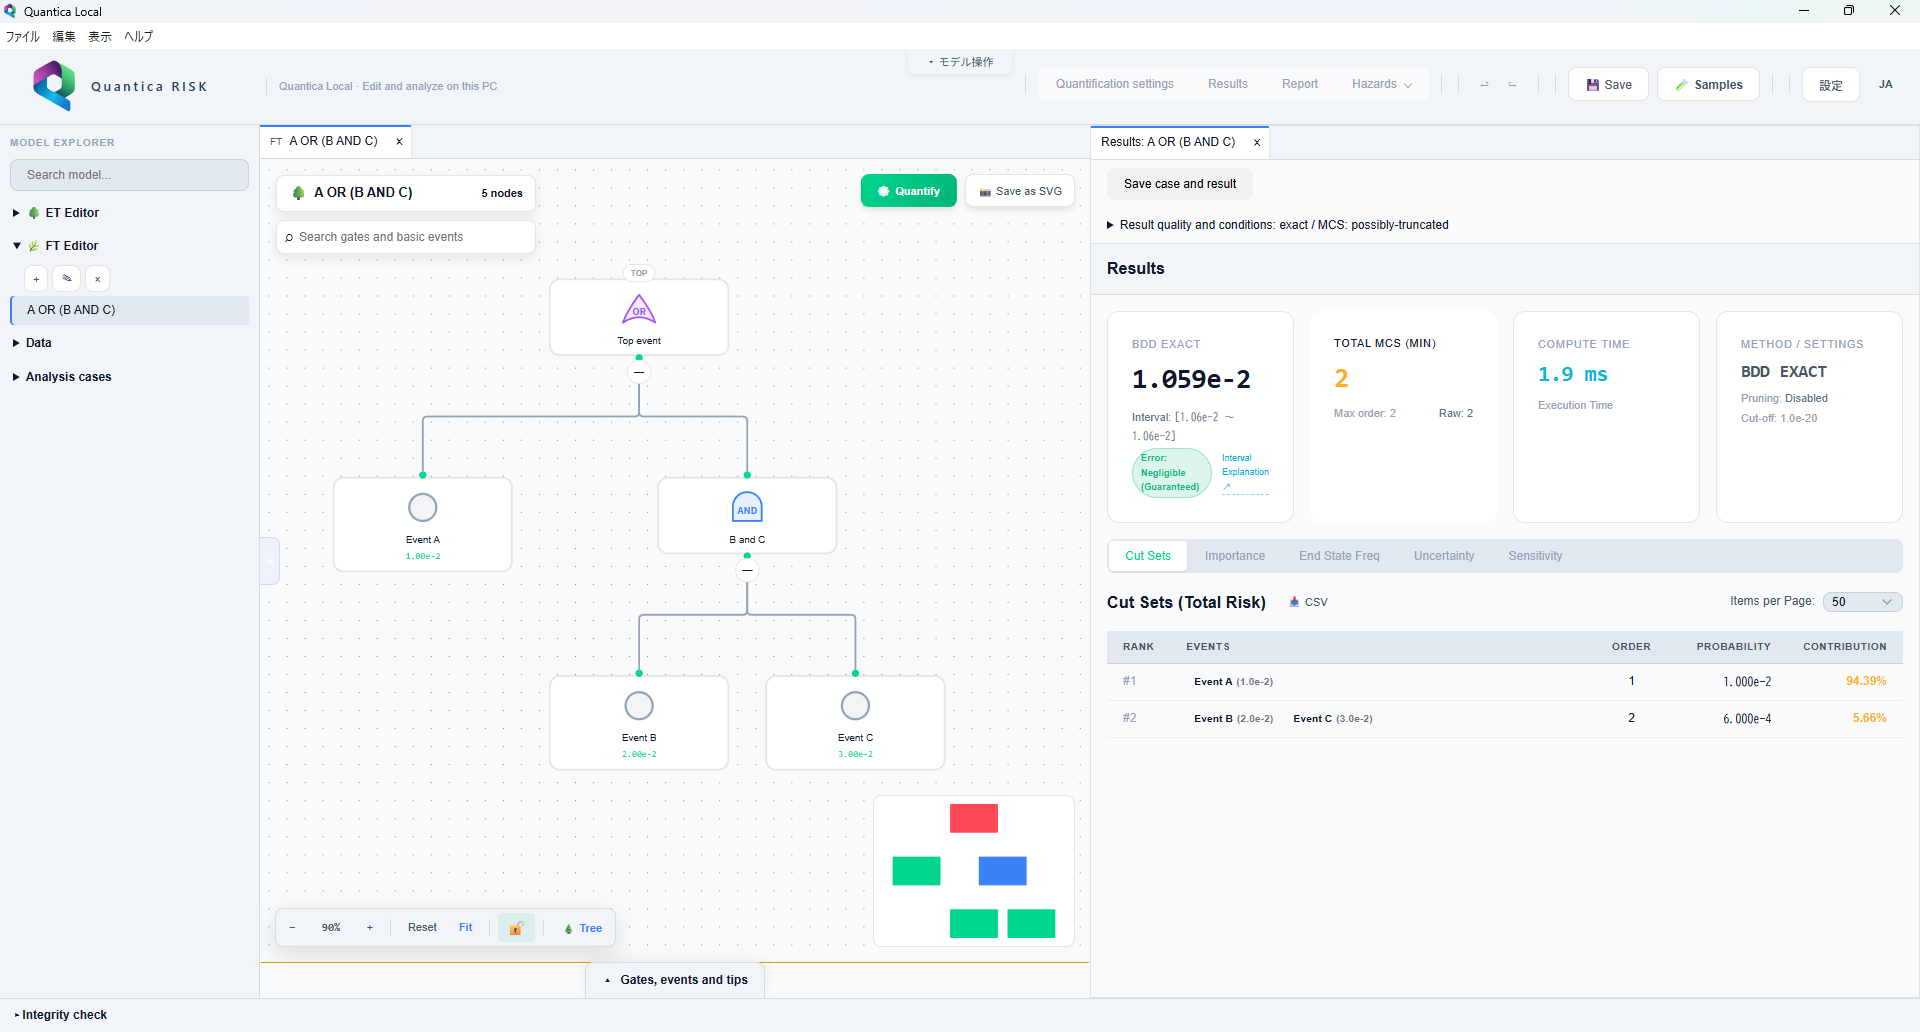
Select the image to open it at full size.
FOR YOUR ANALYSIS
When considering analysis software, use your own models and analysis conditions to examine the model structure, calculation methods and interpretation of results.
Quantica RISK supports the PRA workflow: from models to results, and from results back to events.
Revisit the analytical example